
Free, open-source QDA software,
built for researchers — not profits.
Magnolia is full-featured qualitative data analysis (QDA) software — powerful coding, graphical queries, relationship maps, and a rich analysis suite, all running locally on your machine.
Free forever · Released under the EUPL
Magnolia is experimental. It was coded by Claude over several months. It may break unexpectedly, and you should use it at your own risk.
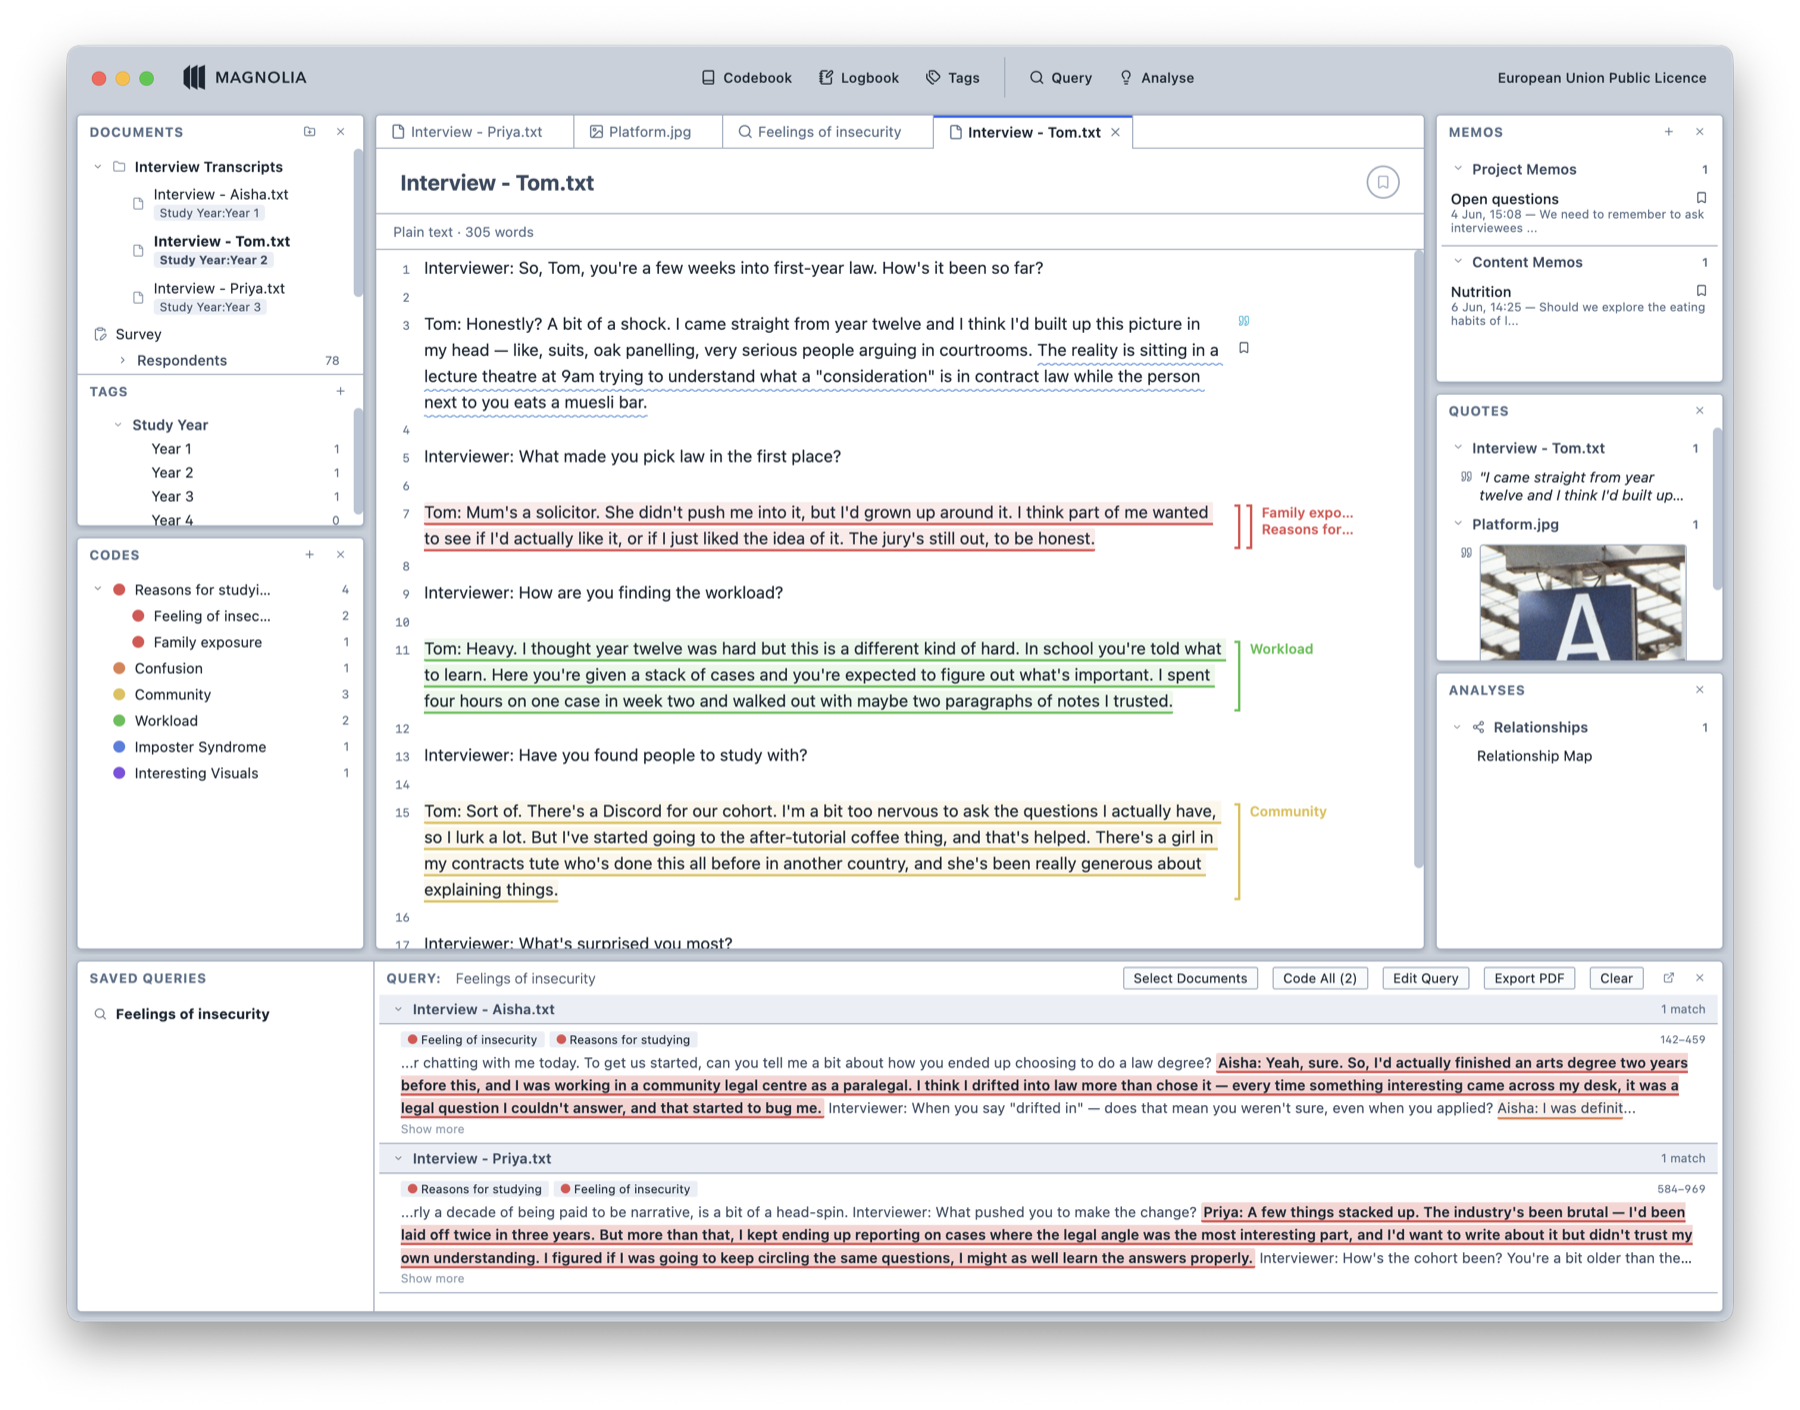
Open science needs open tools.
Magnolia was created out of the fundamental belief that the principles of open science are not advanced if the tools people need to do qualitative research require expensive subscriptions or prioritise proprietary formats.
Magnolia, by contrast, is free. No one is profiting off it. There are no paid features. There are no subscriptions. There's no cloud. There is no advertising. There is only the option to sponsor the creator on GitHub if you want to, but that is completely optional.
Magnolia also reads and writes the open QDPX standard — by default. Proprietary formats do not advance open science.
A free, open-source alternative to NVivo, Atlas.ti, and MAXQDA.
The established qualitative data analysis tools — NVivo, Atlas.ti, and MAXQDA — are powerful, but they're proprietary. They also cost hundreds of euros a year. Magnolia gives you a full QDA workspace for free, and because it reads and writes the open QDPX standard, you can bring existing projects with you.
| Feature | Typical paid QDA tools | Magnolia |
|---|---|---|
| Price | Licence fee or annual subscription of upwards of 240 EUR | Free forever |
| Source code | Proprietary | Open source under the EUPL |
| Your data | May require an account or the cloud | 100% local — no account, no cloud |
| File format | Often proprietary | Native open QDPX standard |
| Platforms | Varies | macOS · Windows · Linux |
A general comparison — other tools' features and pricing change over time. See the FAQ for more.
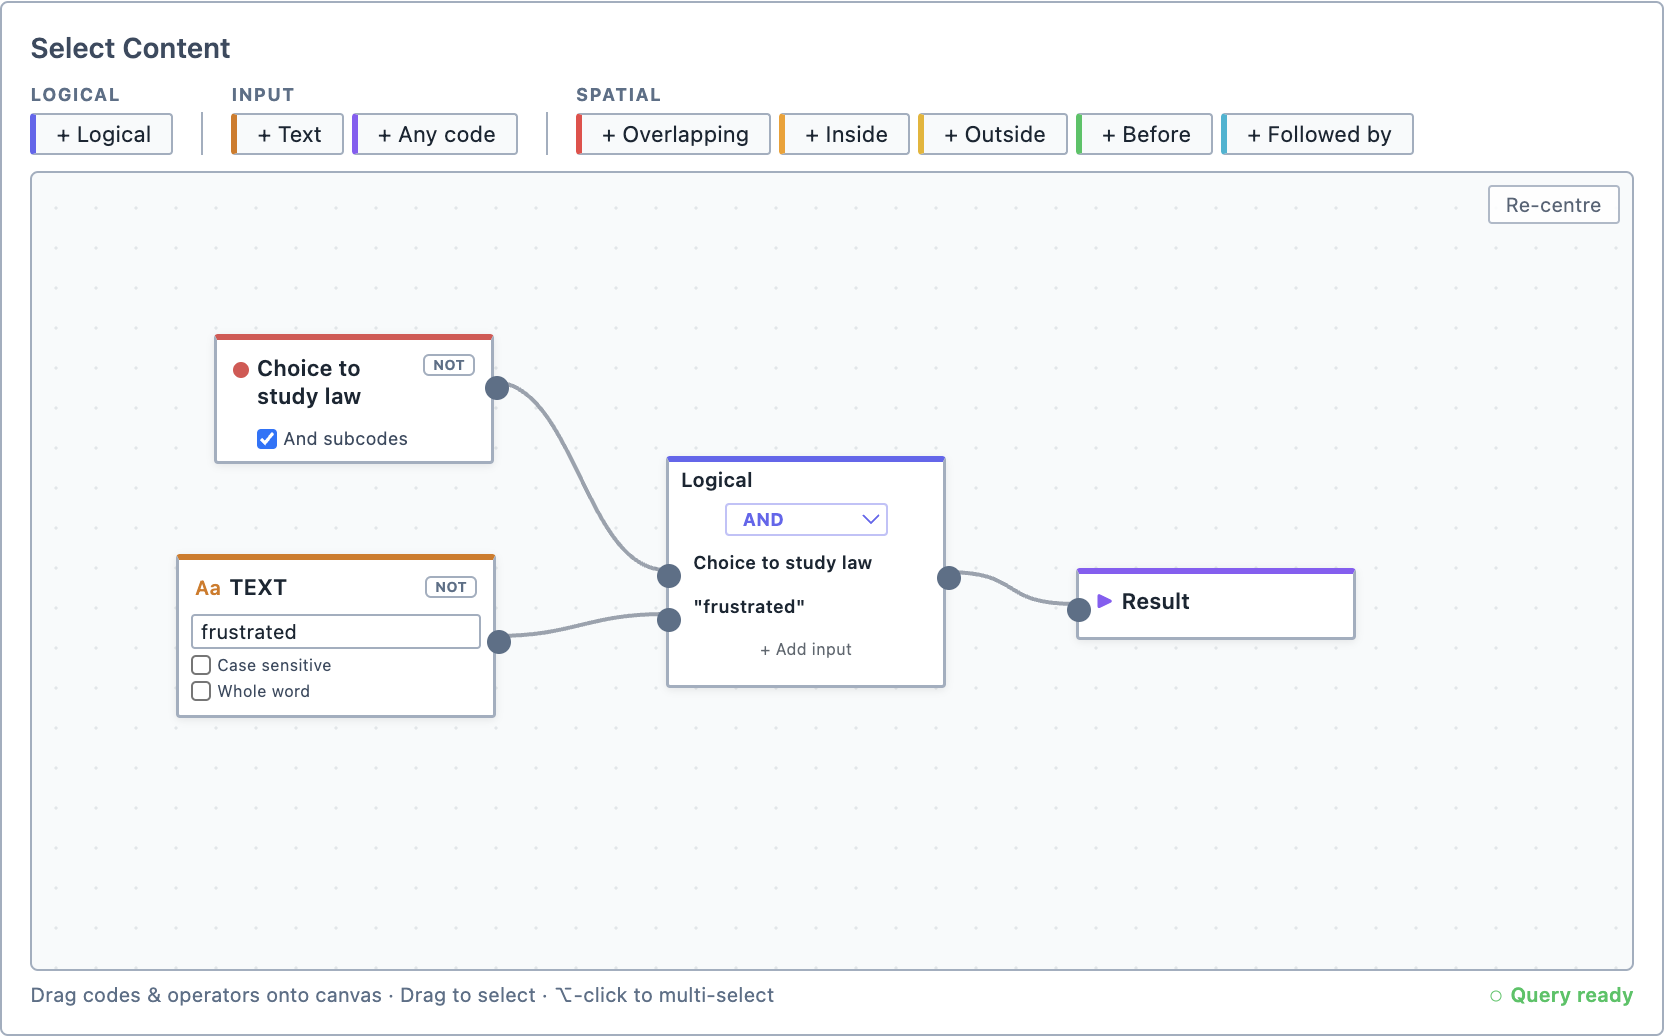
Powerful coding, powerful queries.
Magnolia's intuitive, graphical query builder lets you interrogate your data by dragging code nodes and logical operators onto a canvas.
- Results update in real time — even while you're still coding.
- Save queries and re-run them whenever your data changes.
- Scope any query to specific documents, folders, types, or tags.
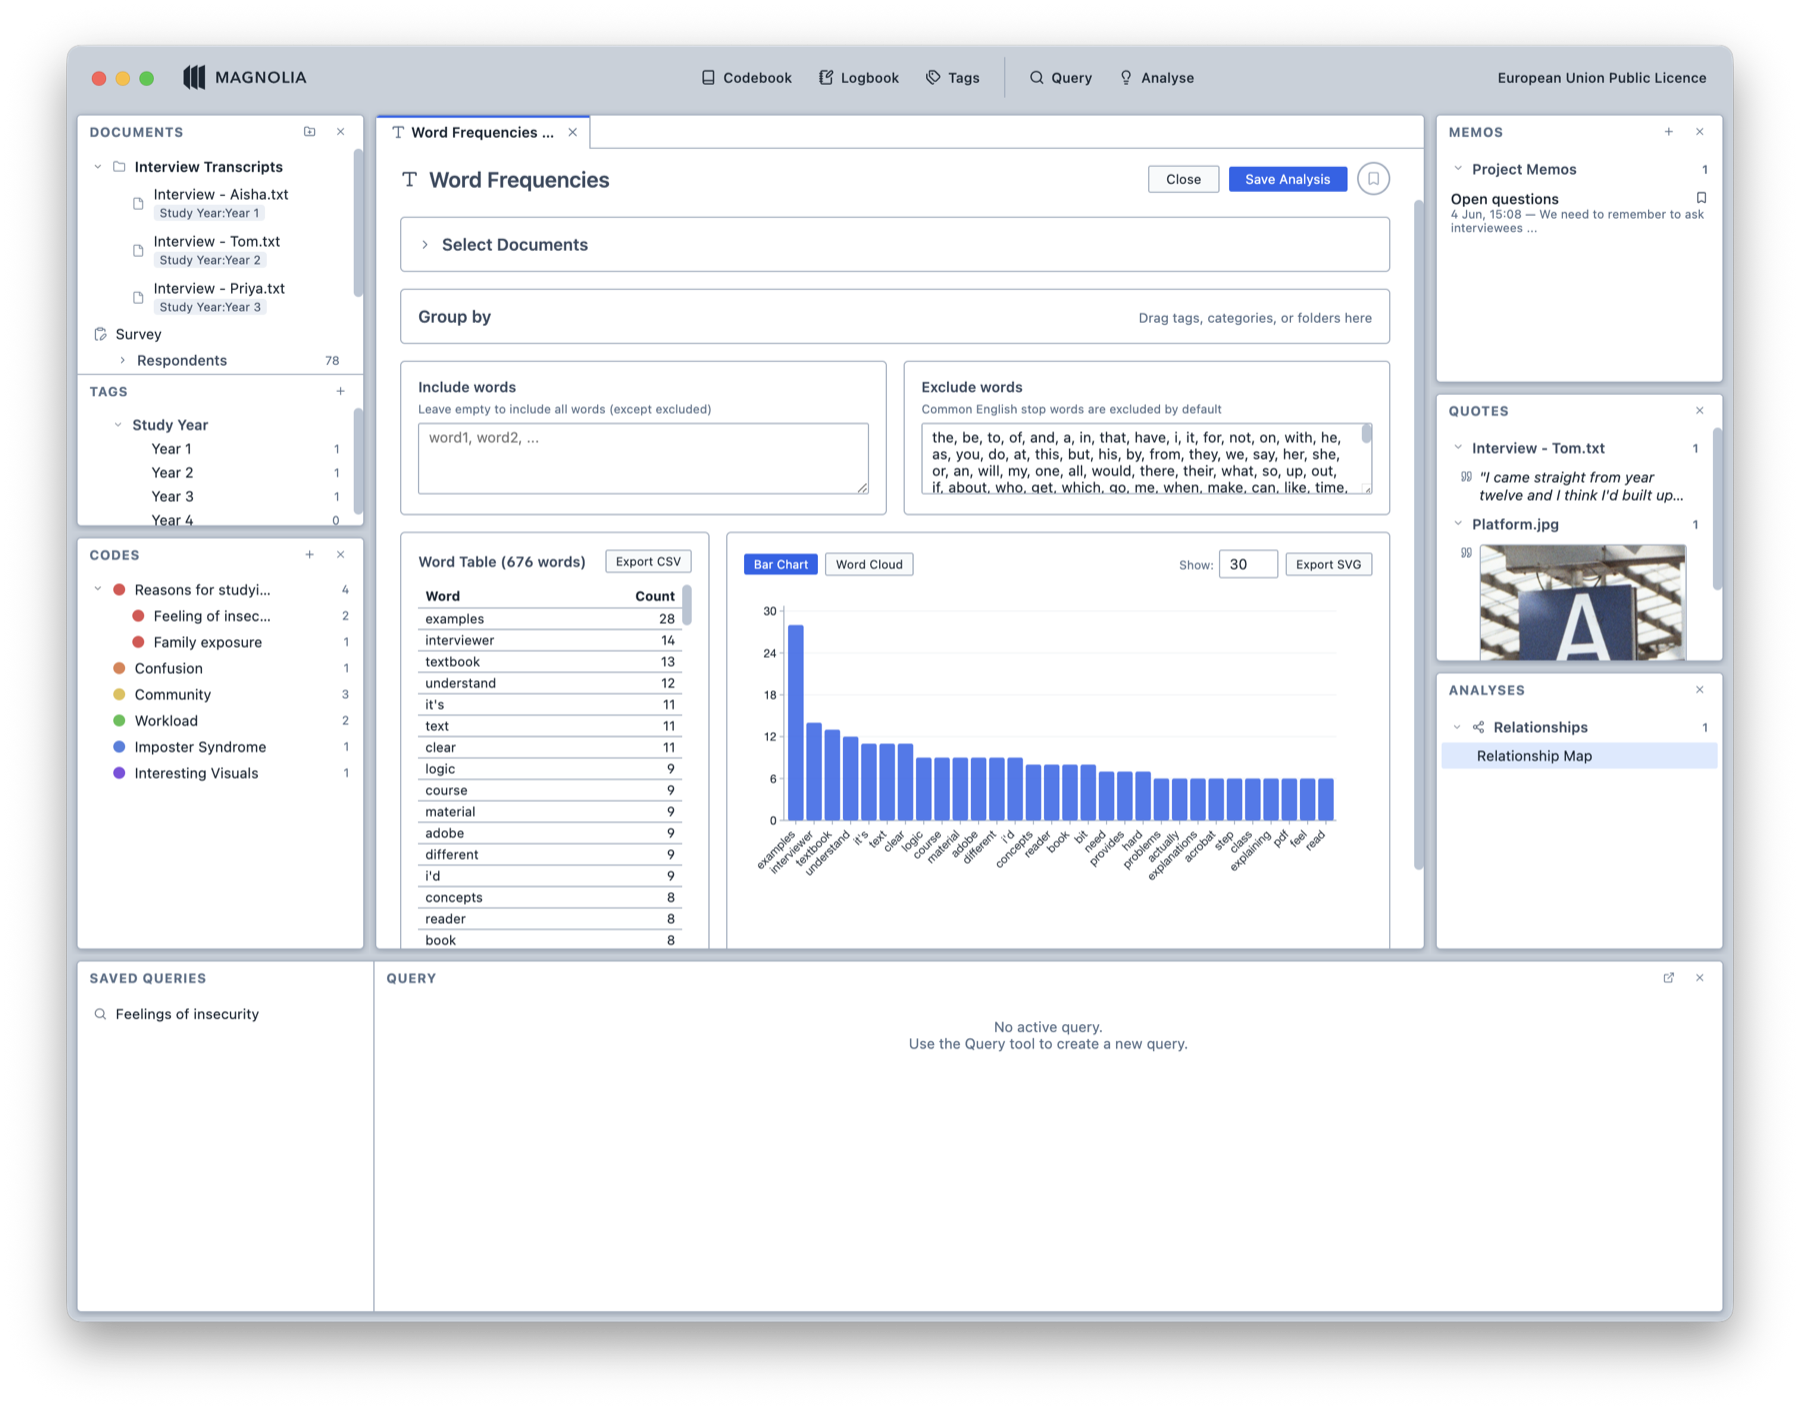
Interrogate your data from every angle.
Magnolia's powerful analytical tools let you explore your data and do the research you always wanted.
- Interactive results let you click in tables, graphs, and word clouds and be taken to the underlying data.
- Powerful grouping tools let you cluster and summarise your results.
- Save analyses for later.
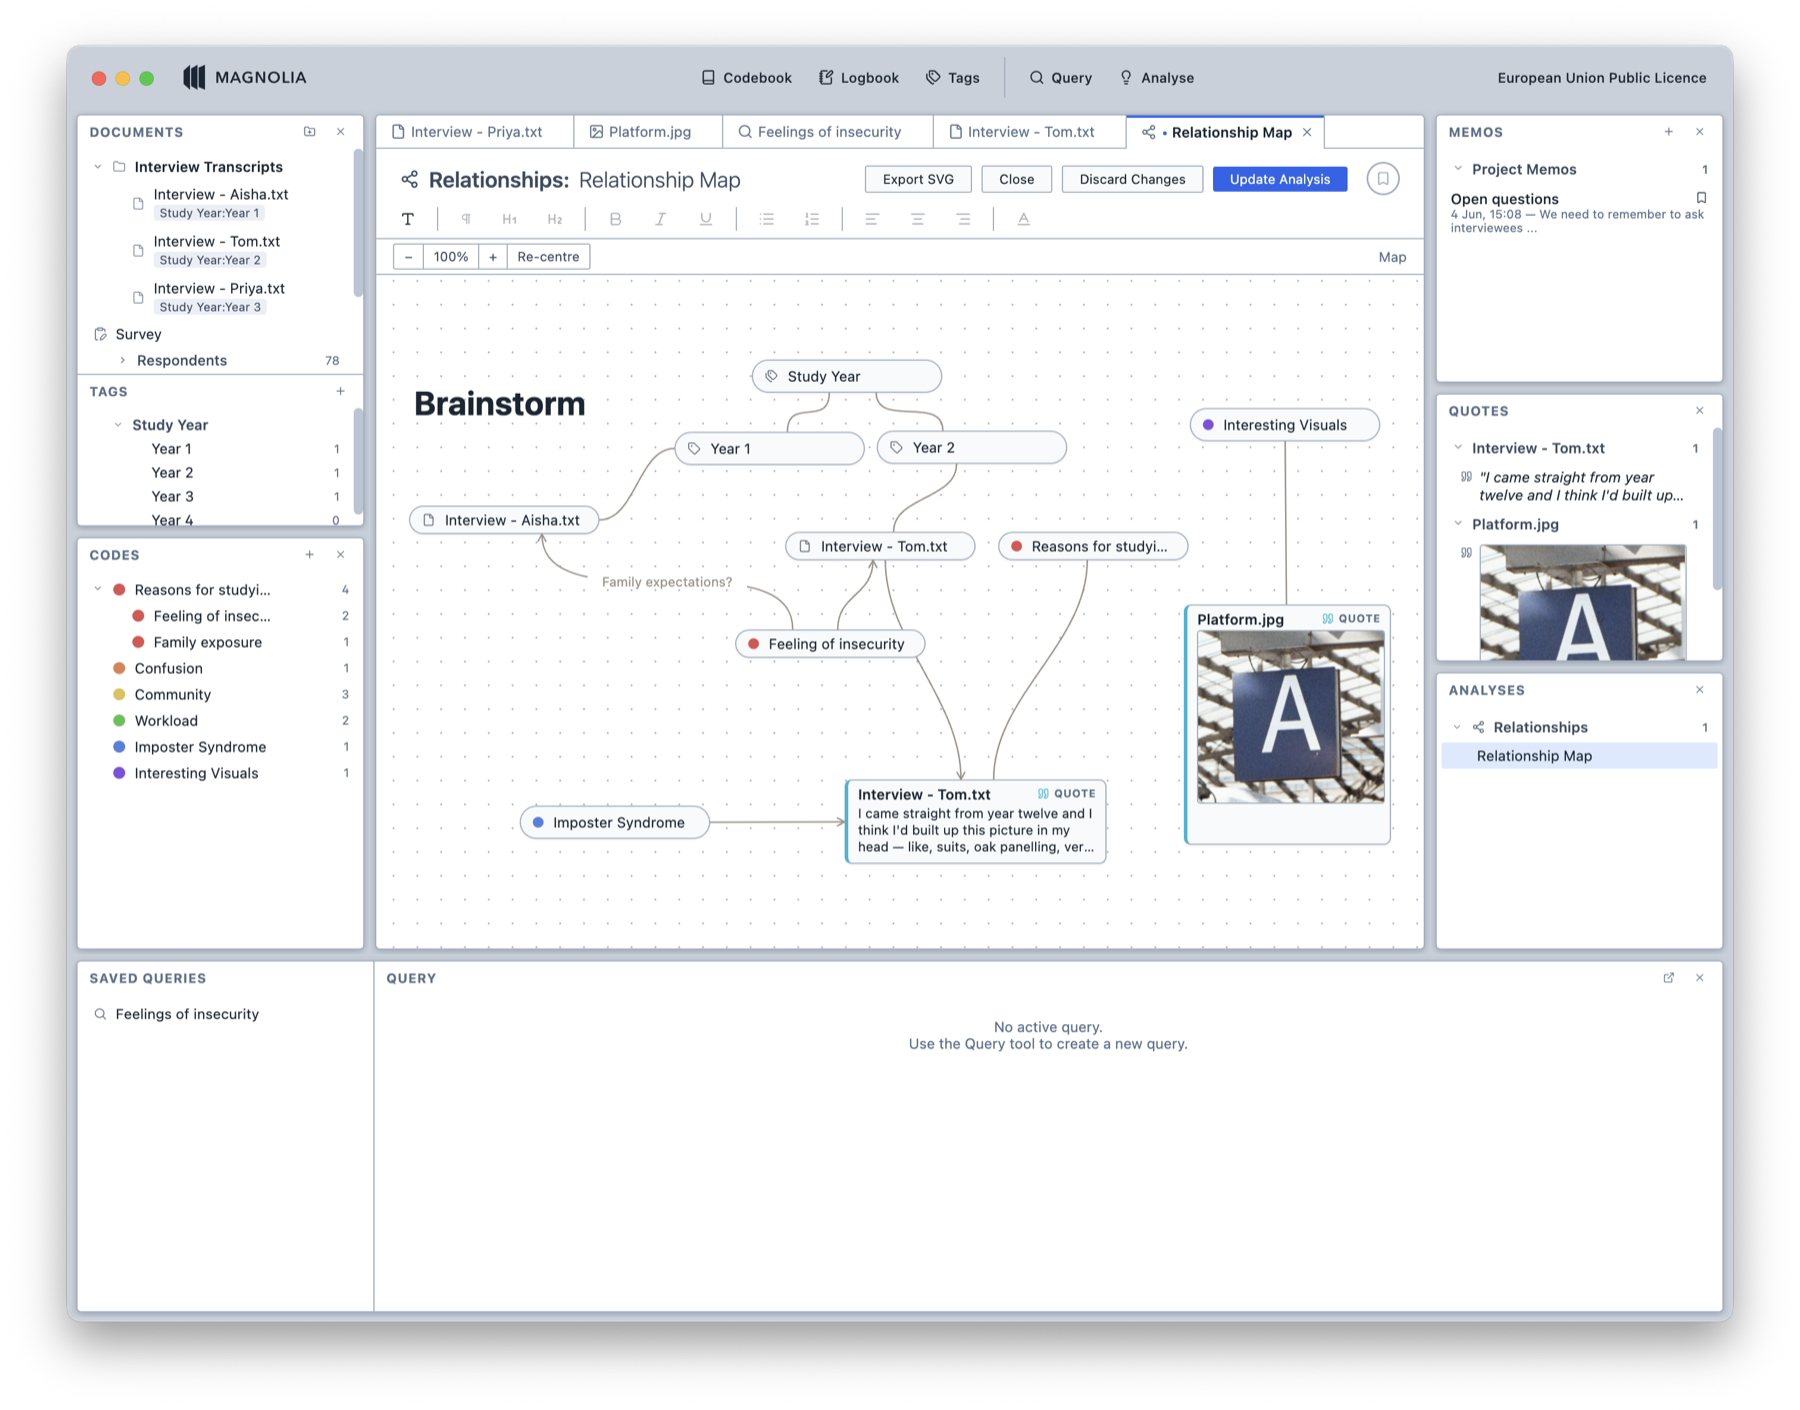
Map anything and everything.
Drag codes, documents, and quotes onto an interactive canvas to map the relationships in your data. Everything stays live: double-click any node and you're taken straight to it.
- Fully interactive — your map is a navigation tool, not a static picture.
- Attach memos to anything on the canvas.
- Export the whole map as a clean, scalable SVG.
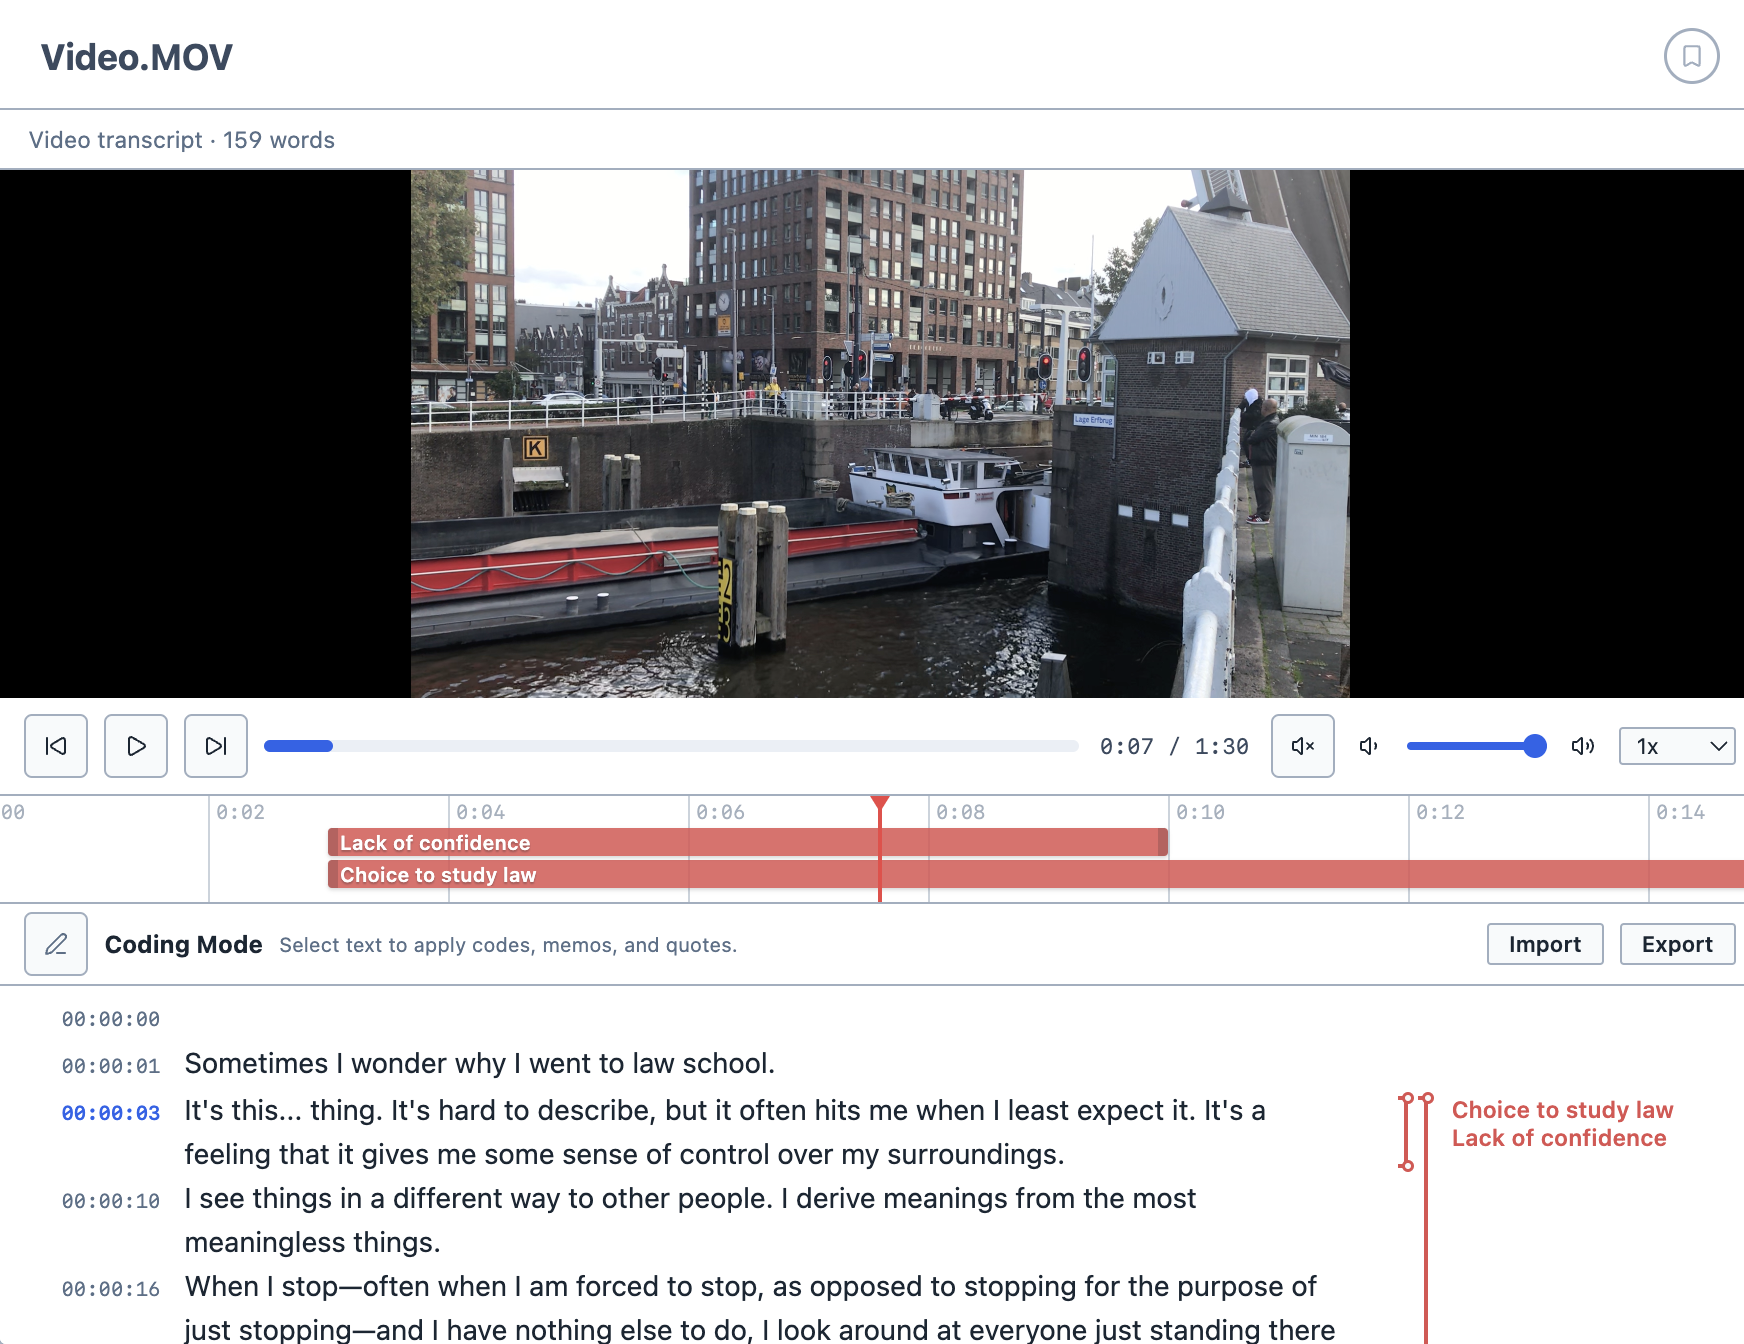
Transcribe with ease, and code logically.
Magnolia's in-built transcription module allows you to easily transcribe audio and video files. And with synced video coding, your video and transcript have just one set of codes.
- Support for foot pedals: simply map your chosen hotkey to the pedal, and away you go.
- New line, new timestamp.
- Video codes are mapped to timestamps, so your video track codes and transcript codes are the same.
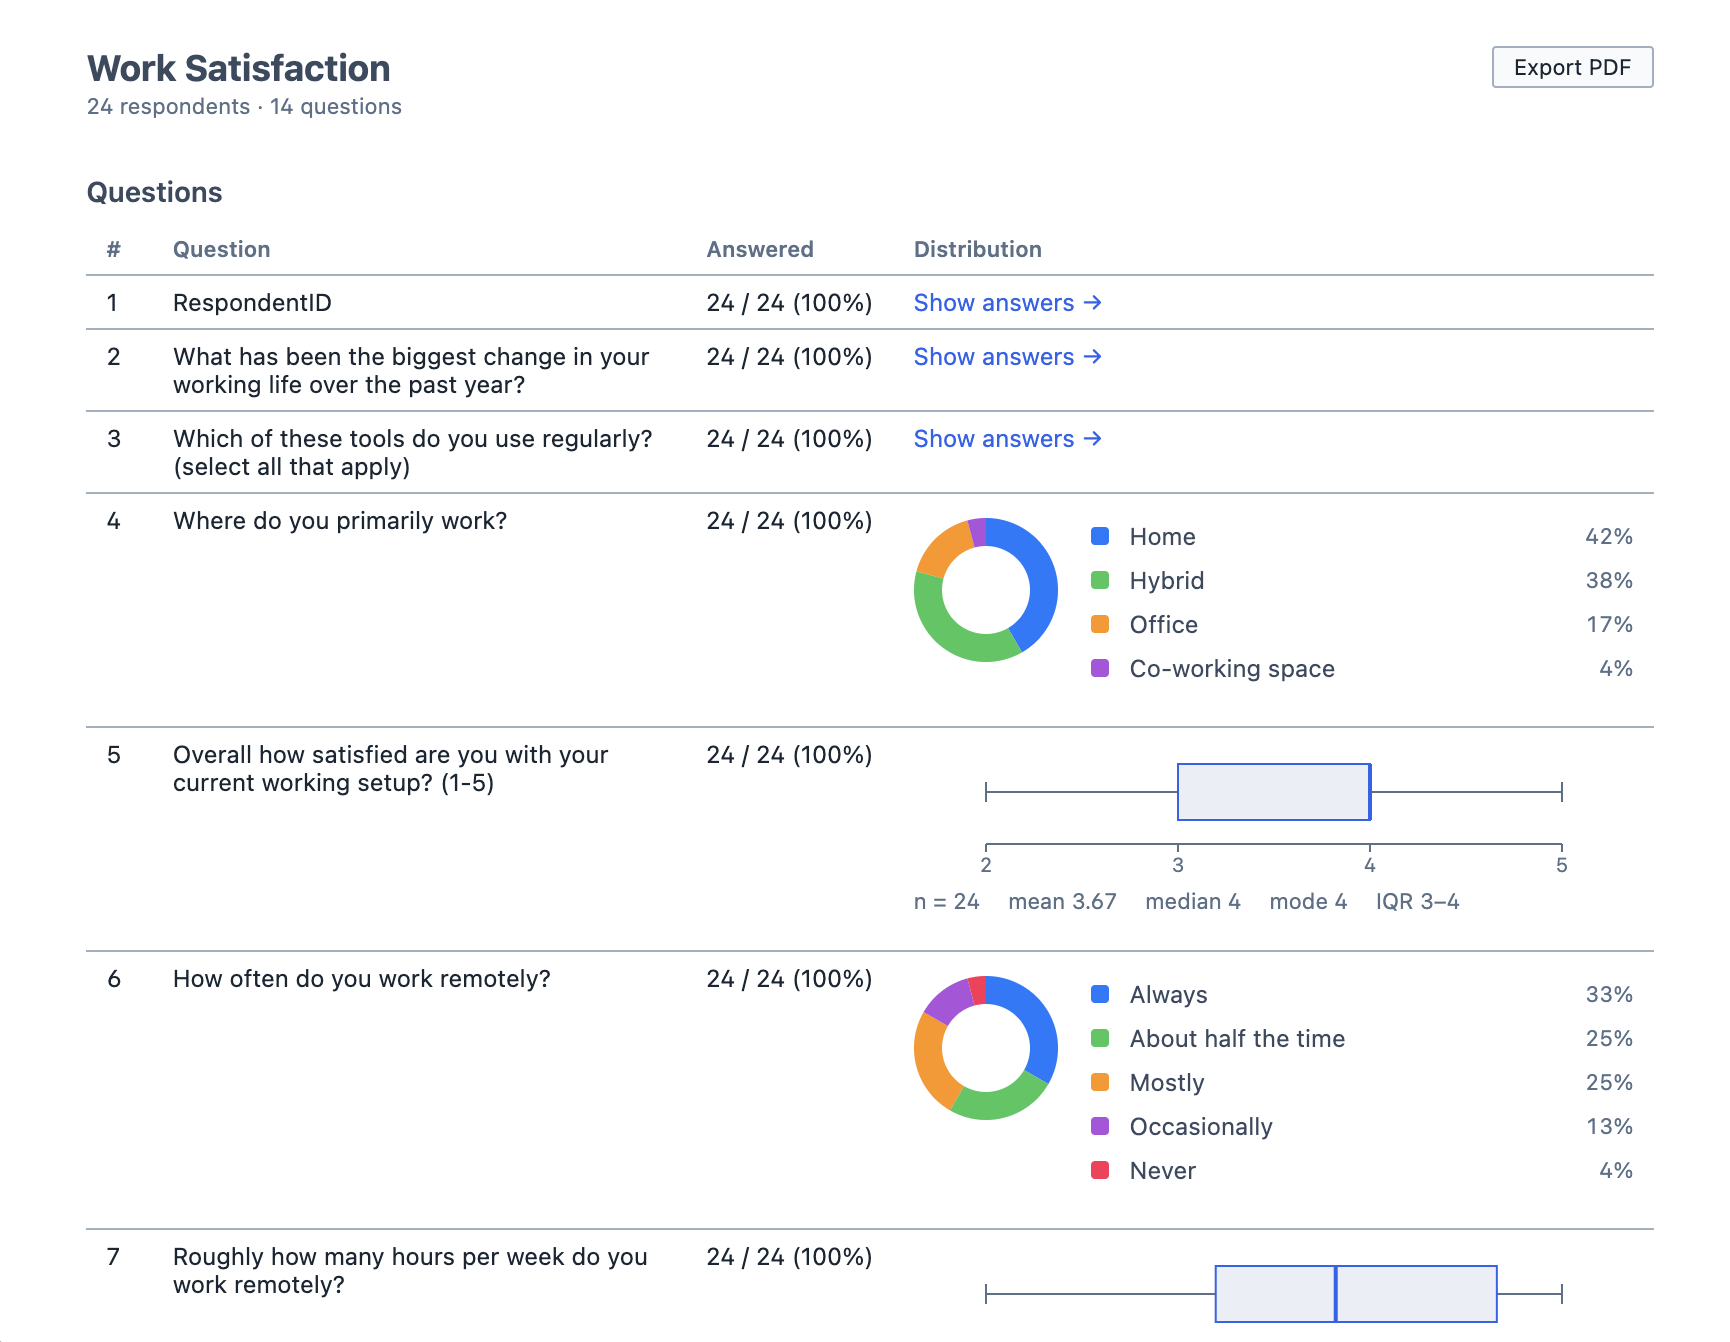
Explore your survey data qualitatively and quantitatively.
Magnolia's support for survey data lets you code open responses, and understand how quantitative questions were answered.
- Survey data stays together: it isn't broken into individual documents.
- See an overview of your results and export it as a report.
- Support for .xlsx and .csv files.
Everything you need to interrogate your data.
- Relationships
- Map relationships between different things.
- Codes in Documents
- See which documents contain which codes.
- Results in Documents
- See which documents contain which query results.
- Code Co-Occurrences
- See which codes overlap with each other.
- Code Orders
- See the order in which codes appear in each document.
- Code Frequencies
- See how much of each document is covered by each code.
- Word Frequencies
- See which words often appear.
- Reports
- Compile results into an exportable PDF report.
Your data never leaves your machine.
No account, no cloud sync, no telemetry. Your project lives as a file on your own disk or network drive — exactly where you put it.
Bring in almost anything.
Text
.txt · .md · .markdown · .pdf · .docx · .rtf · .odt
Images
.jpg · .jpeg · .png · .gif · .webp · .tif · .tiff · .heic · .heif
Audio
.wav · .mp3 · .ogg · .flac · .m4a · .aac
Video
.mp4 · .mov · .avi
Surveys
.csv · .xlsx
.docx, .rtf, and .odt files are converted to PDF on import.
Free for everyone, forever.
Magnolia is released under the EUPL. Everyone is free to use it, reproduce it, change it, and share their changes. If Magnolia or a derivative is distributed, it must stay under the EUPL with its source freely available.